Insight debugger is easy to use. This debugger can be used to simulate code, download code into target and debugging the code.
In previous article we have seen configuring of Insight Debugger with eclipse. In this article use of insight debugger is shown.
RUNNING PROGRAM ON INSIGHT SIMULATOR
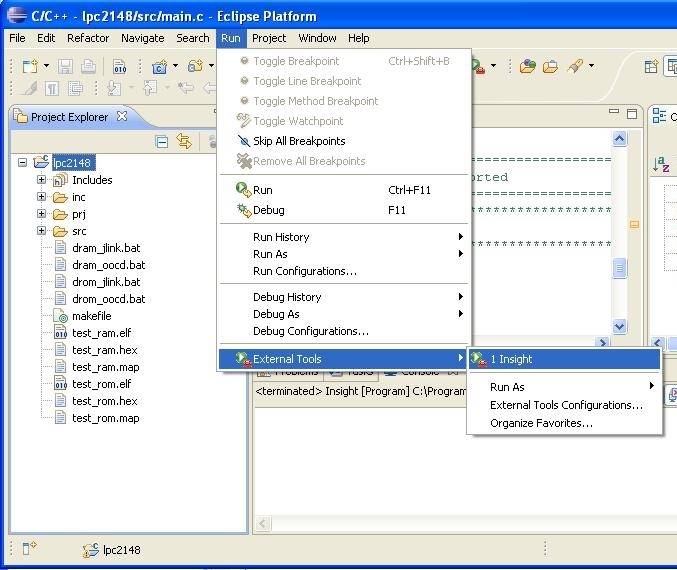
Now we are ready to run our program on simulator. For that Go to Run > External Tools > External Tools Configuration > Insight
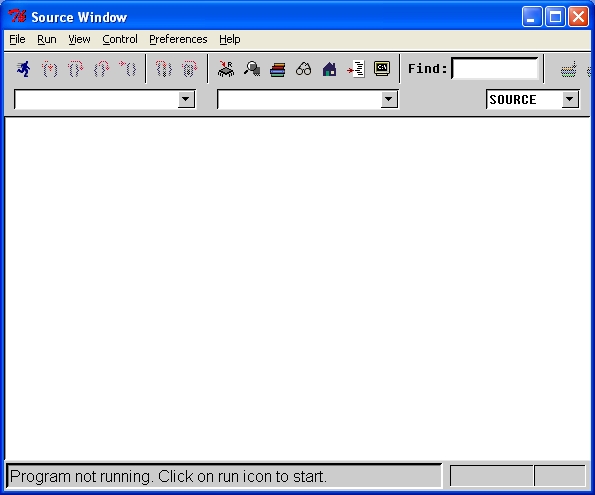
After that insight debugger window will open.
Now let us open our program to test.
For that go to File > Open and select test_ram.elf file to debug.
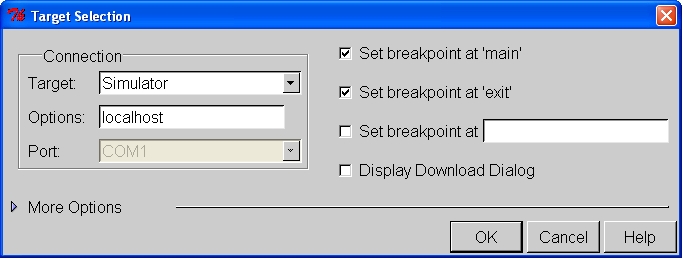
Now we have to do target setting. For that go to File > Target Settings
Here in the target options select Simulator and Click on OK.
After that let us connect with target. For that Go to Run > Connect with target.
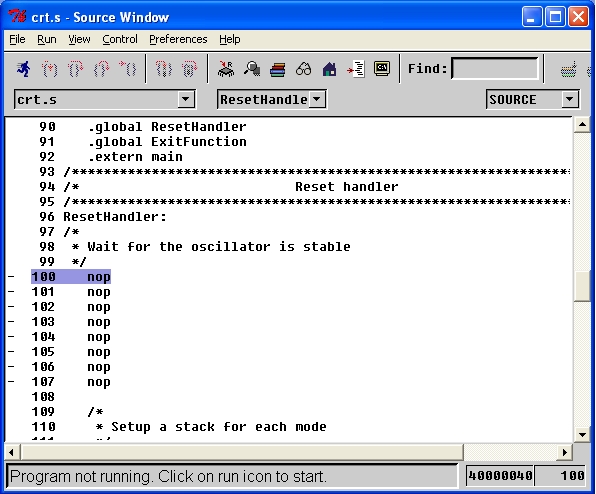
After that window will look like this:
Now Click on Run > Run or Press R
If GDB warning window comes then click on No option .
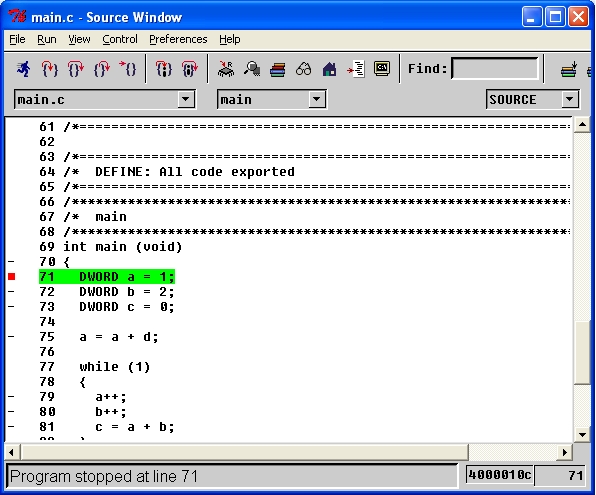
After that you can see code is stopped at main. Now we can execute code by either single stepping or running code freely.
We can view the value of local variables, memory locations etc. Green color strip will show the current statement.
Following is the list of short cut of Insight debugger.
COMMAND SHORTCUT
Download Control + D
Run R
View StackControl + S
View RegisterControl + R
View Local Var. Control + L
View Functions Control + F
View Expressions Control + T
View Breakpoint Control + B
View Console Control + N
View Threads Control + H
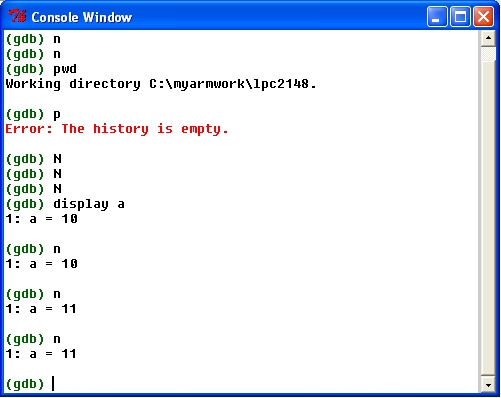
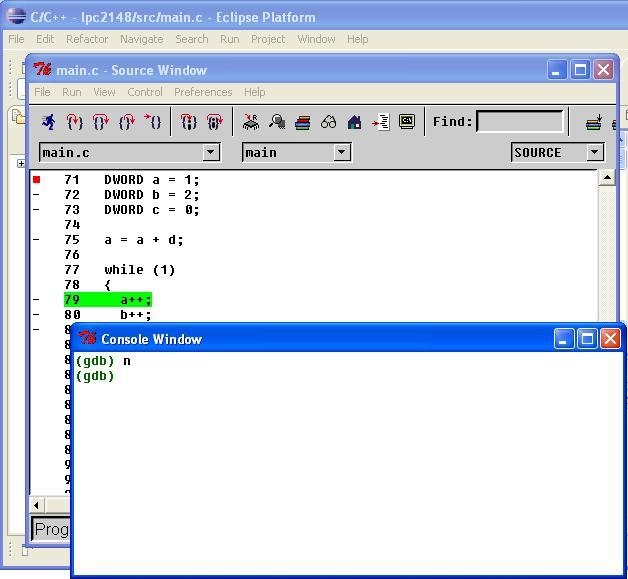
We can also open console and use GDB commands from it.
Following are the list of few GDB commands
GDB COMMAND
Execution of Next Statement n
Continue c
Loading of executable fileload <file name>
Program executionr
Watching content of variable display <name variable>
Connect to target target <target name>
target name = sim
help command help
Quit quit
Gdb commands can be run in console. here you can see prompt of gdb.
You can found all gdb commands from help command.
So, in this way you can install and start using gcc and eclipse for ARM software development.